ECharts画动态仪表盘+柱状图(ajax获取+循环画图)
出来工作几个月了,整理下最近学的的东西。刚刚才开通博客,第一篇就先画仪表盘+柱状图。
有什么写的不好的地方,请大家多多指教!
jsp中首先要引用几个文件:
<script type="text/javascript" src="../Js/ECharts/echarts.js">script>
<script type="text/javascript" src="../JqueryCss/js/jquery.min.js">script>
<script type="text/javascript" src="../xx/xxx.js">script>
/xx/xxx.js 是我js代码存放的文件。
<div id="cpu" style="width:100%;height:100%;">div>
<div id="power" style="width:100%;height:100%;">div>
<div id="fans" style="width:100%;height:100%;">div>
仪表盘就画在这个div里面。
接下来写js,开始画图了。
$(document).ready(function(){  refresh();
});
用ajax提交,取值。把值放入数组中,有几个值就画几个图出来。
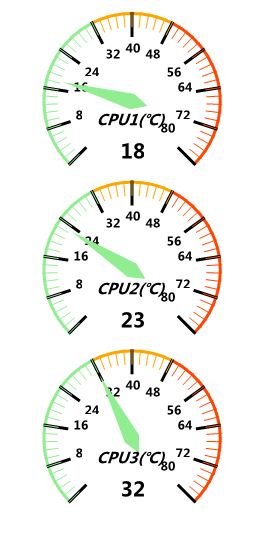
function refresh(){$.ajax({type:"post",//传递方式,默认的时get contentType: "application/x-www-form-urlencoded; charset=gb2312", data:{assetID:assetID},//传递的参数url:path+"/physical.do?method=perf",//提交到哪个ActiondataType: "json",success:function(data){var cpuList = data.cpuList; var cpuArray = new Array(); $.each(cpuList, function(i, n){ cpuArray[i]=n.item_val; }); refreshCPU(cpuArray);var powerList = data.powerList; var powerArray = new Array(); $.each(powerList, function(i, n){ powerArray[i]=n.item_val; });refreshWatts(powerArray);var fanList = data.fanList; fans(fanList);} }});}先画整个圆的仪表盘
function refreshCPU(varArray){var centerx;var size;var seriesArray = new Array();for (var i=0;ilength;i++){if(varArray.length<3){centerx = i*35+22;size = 70;}else{centerx = i*24+14;size = 55;}seriesArray.push({name:'温度',type:'gauge',center : ['50%', centerx+'%'],    // 默认全局居中radius : size+'%',min:0,// 最小值max:80,// 最大值splitNumber:10,// 分割段数,默认为5axisLine: {            // 坐标轴线lineStyle: {       // 属性lineStyle控制线条样式color: [[0.4, 'lightgreen'],[0.6, 'orange'],[1, '#ff4500']],//设置刻度值的颜色width: 3,shadowColor : '#fff', //默认透明shadowBlur: 10}},axisLabel: {            // 坐标轴小标记textStyle: {       // 属性lineStyle控制线条样式fontWeight: 'bolder',color: '#000',shadowColor : '#fff', //默认透明shadowBlur: 10}},axisTick: {            // 坐标轴小标记length :15,        // 属性length控制线长lineStyle: {       // 属性lineStyle控制线条样式color: 'auto',shadowColor : '#fff', //默认透明shadowBlur: 10}},splitLine: {           // 分隔线length :25,         // 属性length控制线长lineStyle: {       // 属性lineStyle(详见lineStyle)控制线条样式width:3,color: '#000',shadowColor : '#fff', //默认透明shadowBlur: 10}},pointer: {           // 指针样式 shadowColor : '#fff', //默认透明shadowBlur: 5},title : {//设置标题的属性offsetCenter: [0,'30%'], //标题位置textStyle: {       // 其余属性默认使用全局文本样式,详见TEXTSTYLEfontWeight: 'bolder',fontSize: 15,fontStyle: 'italic',color: '#000',shadowColor : '#fff', //默认透明shadowBlur: 10}},detail : {backgroundColor: '#fff',borderWidth: 1,borderColor: '#fff',shadowColor : '#fff', //默认透明width: 50,height:50,offsetCenter: [0, '65%'],       // x, y,单位pxtextStyle: {       // 其余属性默认使用全局文本样式,详见TEXTSTYLEfontWeight: 'bolder',fontSize: 20,color: '#000'              }},data:[{name: 'CPU'+(i+1)+'(℃)', value: varArray[i]}]});}var option = {backgroundColor: '#fff',tooltip : {formatter: "{a}
{c} {b}"},grid : {  width : '20%' , //直角坐标轴占整页的百分比  height : '100%'  },  series : seriesArray};  var myChart = echarts.init(document.getElementById("cpu"));myChart.setOption(option,true);// 使用刚指定的配置项和数据显示图表。}
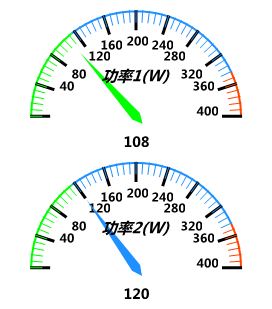
再画半圆的仪表盘
function refreshWatts(varArray){var centerx;var size;var seriesArray = new Array();for (var i=0;ilength;i++){if(varArray.length<=3){centerx = i*30+21;size = 80;}else{centerx = i*22+17;size = 65;}seriesArray.push({name:'电压',type:'gauge',center : ['50%', centerx+'%'],      // 默认全局居中radius : size+'%',min:0,max:400,startAngle:180,//开始角度endAngle:0,//结束角度splitNumber:10,axisLine: {            // 坐标轴线lineStyle: {       // 属性lineStyle控制线条样式color: [[0.29, 'lime'],[0.86, '#1e90ff'],[1, '#ff4500']],width: 2,shadowColor : '#fff', //默认透明shadowBlur: 10}},axisLabel: {            // 坐标轴小标记textStyle: {       // 属性lineStyle控制线条样式fontWeight: 'bolder',color: '#000',shadowColor : '#fff', //默认透明shadowBlur: 10}},axisTick: {            // 坐标轴小标记length :12,        // 属性length控制线长lineStyle: {       // 属性lineStyle控制线条样式color: 'auto',shadowColor : '#fff', //默认透明shadowBlur: 10}},splitLine: {           // 分隔线length :20,         // 属性length控制线长lineStyle: {       // 属性lineStyle(详见lineStyle)控制线条样式width:3,color: '#000',shadowColor : '#fff', //默认透明shadowBlur: 10}},pointer: {width:5,shadowColor : '#fff', //默认透明shadowBlur: 5},title : {offsetCenter: [0, '-30%'],       // x, y,单位pxtextStyle: {       // 其余属性默认使用全局文本样式,详见TEXTSTYLEfontWeight: 'bolder',fontStyle: 'italic',color: '#000',shadowColor : '#fff', //默认透明shadowBlur: 10}},detail : {borderColor: '#fff',shadowColor : '#fff', //默认透明width: 80,height:30,offsetCenter: [0, '30%'],       // x, y,单位pxtextStyle: {       // 其余属性默认使用全局文本样式,详见TEXTSTYLEfontWeight: 'bolder',fontSize: 14,color: '#000'}},data:[{value: varArray[i], name: '功率'+(i+1)+'(W)'}]});}var option = {backgroundColor: '#fff',tooltip : {formatter: "{a}
{c} {b}"},grid : {  width : '20%' , //直角坐标轴占整页的百分比  height : '100%'  },  series : seriesArray};     var myCharts = echarts.init(document.getElementById("power"));myCharts.setOption(option,true);// 使用刚指定的配置项和数据显示图表。}
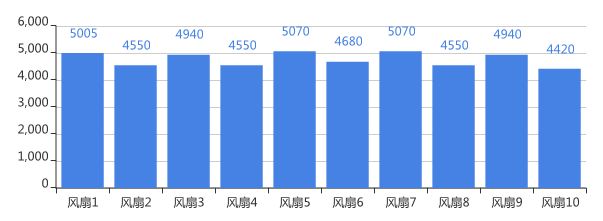
最后再画一个柱状图
function fans(fanList){var option = {tooltip : {trigger: 'axis'},grid: {x: 60,y: 30,x2: 20,y2: 30 },calculable : true,xAxis : [{type : 'category',splitLine:{show: false},data :(function(){ var arr=[]; $.each(fanList, function(i, n){ arr.push("风扇"+(i+1)); }); return arr; })() }],yAxis : [{type : 'value'}],series : [{type:'bar',itemStyle:{normal:{color:'#4682E4',label : {show: true, position: 'top'}}},data :(function(){ var arr=[];$.each(fanList, function(i, n){ arr.push(n.item_val);}); return arr;})() }]};var myChart = echarts.init(document.getElementById("fans"));myChart.setOption(option,true);// 使用刚指定的配置项和数据显示图表。}Action里面的方法
public ActionForward perf(ActionMapping map, ActionForm form,HttpServletRequest request, HttpServletResponse response)throws Exception {String jsonStr = "";HashMap resultMap = new HashMap();HostManagerDao hm = new HostManagerDao(); String assetID = request.getParameter("assetID");try{ ArrayList cpuList = hm.getHostData(assetID, "1"); //处理器温度ArrayList powerList = hm.getHostData(assetID, "2"); //功率ArrayList fanList = hm.getHostData(assetID, "3"); //风扇resultMap.put("cpuList", cpuList); resultMap.put("powerList", powerList);resultMap.put("fanList", fanList);jsonStr = CIGlobalString.getObjectToJSon(resultMap);}catch(Exception ex){ex.printStackTrace();}CIGlobalString.toPrint(request, response, jsonStr);return null;}转json
// 对象转成json对象类型public static String getObjectToJSon(Object obj) {JSONObject json = JSONObject.fromObject(obj);return json.toString();}// 集合转成json对象类型public static String getListToJSon(List list) {JSONArray json = JSONArray.fromObject(list);return json.toString();} public static void toPrint(HttpServletRequest request,HttpServletResponse response, String jsonStr) {try {response.setCharacterEncoding("UTF-8");PrintWriter out = response.getWriter();// System.out.println(jsonStr);out.print(jsonStr);out.flush();out.close();} catch (Exception e) {// TODO Auto-generated catch blocklog.info("对象转换成json类型异常。");}}截个图给大家看看效果

本文来自互联网用户投稿,文章观点仅代表作者本人,不代表本站立场,不承担相关法律责任。如若转载,请注明出处。 如若内容造成侵权/违法违规/事实不符,请点击【内容举报】进行投诉反馈!

